The Trend Stalker Strategy is a trend following system that can be used for scalping, day trading or even swing/weekly trading.
For scalping you can use small time frames like 5M chart, for day trading you can use 15M or higher harts, or swing/weekly trading you can use 4H chart.
The indicators used can be found in any trading platform with build-in indicators but the ready-made emplate works with Metatrader 4 platform. Metatrader 4 platform is a free trading software supported by most brokers.
We will be using 3 different indicators/tools with this system:
1 – Moving Averages , to identify major trend
Moving average 1 : EMA 365 / Close
Moving average 2 : EMA 365/High
Moving average 3 : EMA 365/Low
2 – Bollinger Bands, to identify current trend and breakouts
Period : 30, Shift : 0, Deviation: 3
3 – MACD, for entry signals
Fast EMA: 24, Slow EMA: 72, Signal: 12, Apply to Close
TRADING RULES
A : Identify The Major Trend
For that we will use the moving averages. The process is simple, if price is below
the trend ( as represented by the moving averages ) then we are advised to SELL
ONLY. And if price is above the trend, then we are advised to BUY ONLY.
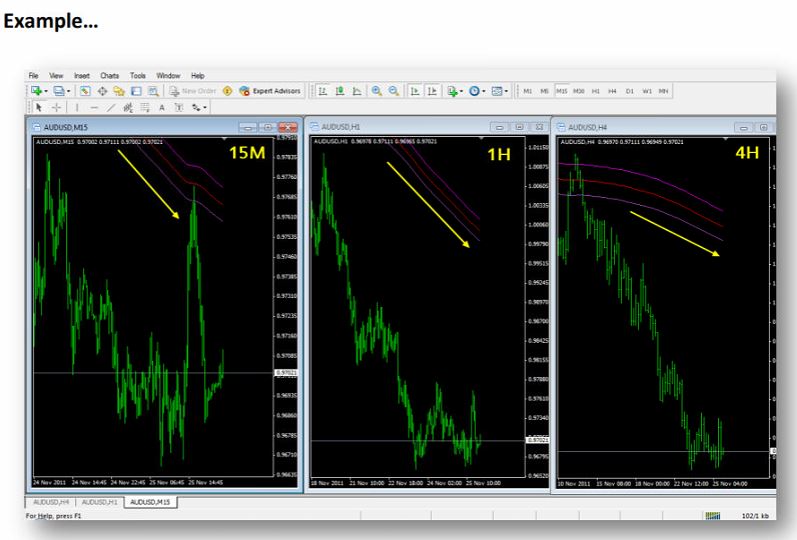
It’s also helpful to notice trend’s direction on multiple time frames. For example,
if you’re trading the 15M chart, then you can move to 30M, 1H or even 4H and
take a look at the trend within higher time frames. If all time frames confirm the
direction that means it’s powerful trend and you can safely follow it
B : Identify Current Trend
After identifying major trend on different time frames, we are going to indentify
trend’s direction on our main trading chart.
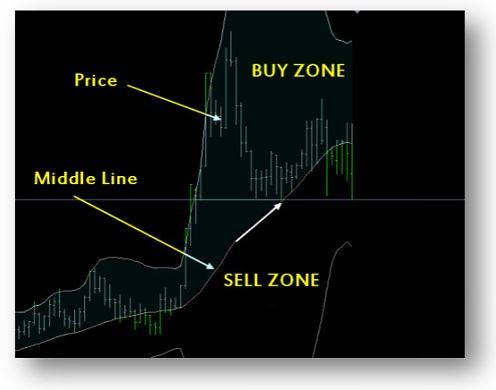
Let’s say we are day trading 15M chart. what we need to do is to notice 2 things:
- Where is price now? at the upper or lower level of Bollinger Bands.
- Where is Bollinger Band’s middle line is going? Trending up or
trending down?
If price is in the upper level of Bollinger bands ( above middle line ) and middle
line is trending down… that would be a “Sell” signal
If price is in the lower level of Bollinger bands ( below middle line ) and middle is
trending down… that would be a “Buy” signal.
IMPORTANT: We are going to follow the signal that follows the major trend’s
direction ONLY.
If major trend is down , we are going to follow sell signals and ignore buy signals.
If major trend is up, we’re going to follow buy signals and ignore sell signals.
C : MACD Entry Signal
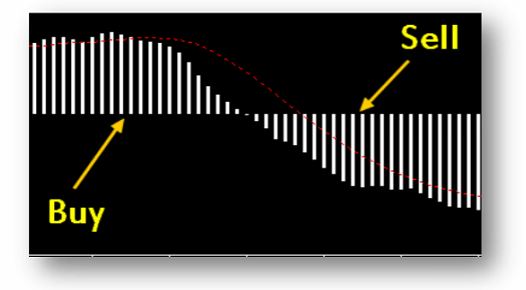
This is the easy part.. When MACD bars above 0 line = Buy Signal, When MACD
bars below 0 line = Sell Signal
IMPORTANT: When you’re checking the major trend on different time frames,
notice MACD bars as well.
It will work as a great filter as well as entry signal. Trading small time frames
would eventually generate many false signals with most indicators, that’s why it’s
important to check higher frames for confirmation.
SL/TP: depending on the timeframe you trade. As we wrote this guide aiming to
more advanced traders, we don’t want to go into details. Thus here we leave it
open that you can use any SL/TP techniques that you want (if you are an
advanced traders).
Putting It All Together – Example
Now you have a good idea about how the system works, but to make you
understand how all elements work together we will provide some live examples in
this section.
AUDUSD – 1H Char
First step, identifying the major trend and checking higher time frames. In this
case we’ll check 4H and Daily Charts.
We noticed that price in sell zone + price below trend line + MACD bars below 0
line.
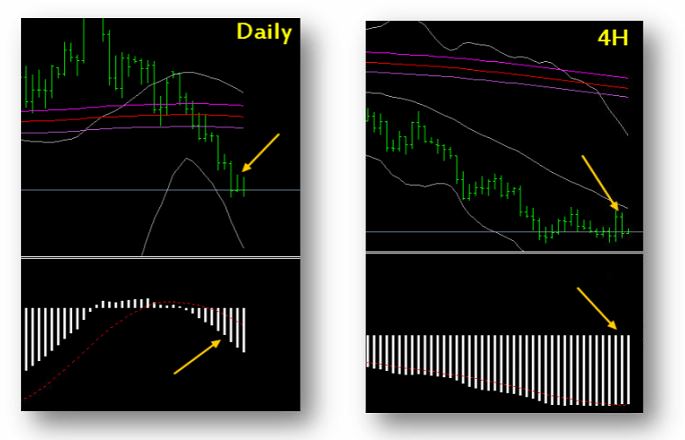
Now we know that the market is telling us “it’s better to sell AUDUSD today!”
Last step is to check our main trading time frame for a valid sell signal…
Here is the trade on 1H chart
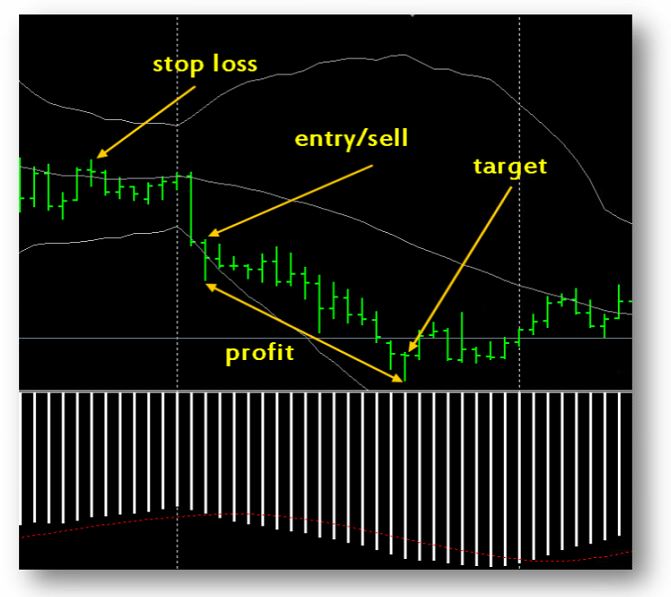
I use support/resistance and Fibonacci levels for stops and targets and if you
know how to use them then they would be very powerful with this system,
especially on time frames like 15 minutes and higher.
If you don’t know how to use such tools you can use the easiest way and set
fixed numbers for stops and targets. Example, 55 pips stop and 75 pips target.
If you’re experienced trader, you can add candle sticks formations to confirm
entry. Example: pin bars and inside pars.
